APPLICATIONS:
The list below is the possible applications for the STR Units. Click the appropriate button to get more details on the twelve applications.
4. Lightning Data & Waveforms
Measurements:

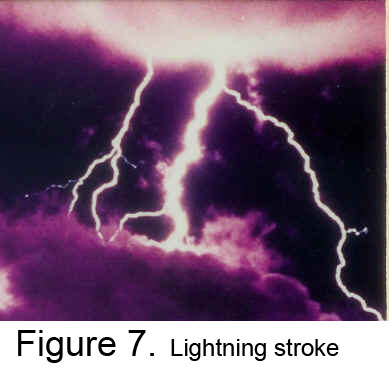
The Basic STR’s measure the actual lightning stroke (see Figure 7.) positive or negative peak current value and waveforms and Option B Units measure the lightning stroke voltage and current waveforms.
Calculations:
The Powernostics® Software shows the actual waveforms of lightning current and voltage and their peak current and voltage values.
Applications:
- Lightning Location and Detection Systems (LLDS) assume a constant velocity of propagation of the lightning stroke. However, this velocity of propagation is dependent on the earth’s resistivity which can vary significantly over the path of the lightning stroke signal. The STR Units measure the actual lightning stroke current and voltage at the location of the Unit. Therefore, more realistic values of lightning magnitudes and energy are derived from the Units’ received data and thus if equipment failures should occur, more exact amplitudes and energy are known as to what caused these failures.
- More accurate location of lightning strokes can be found from multiple STR Units mounted on distribution and transmission lines.
- Different Basic Impulse Insulation Level ( BIL) ratings may be evaluated to determine if equipment BIL ratings should be increased or decreased with either reduced probable failures or resultant economic benefits.
- Lightning stroke data is a primary input parameter for algorithms to be used to predict the number of transformer failures that are likely to occur as a function of equipment density within various regions of an electric utility service area.
Benefits:
- LLDS data for current and voltage of a lightning stroke is only an approximation, since the receiving station may be located a considerable distance from the equipment that failed due to what is assumed to be the magnitude that caused the failure. Also energy levels are not available from the LLDS. Having actual measured data provides more realistic values as to the probable cause of failure. This measured data can be compared to the equipment BIL of the failed component and analysis of such failures can result in more realistic BIL equipment ratings as a function of the actual distribution of lightning stroke data and the economic benefit of either higher or lower equipment BIL ratings.
- Algorithms have been developed based on LLDS data (see
.jpg) Figure 8.) to determine the probable number of transformer failures that might occur. This data along with equipment density data is used to predict the number and sizes of distribution transformers that need to be shipped from primary to secondary warehouses so an adequate quantity is available for line crews to replace failed units. This process has resulted in reducing the restoration time to restore service to outaged customers due to lightning equipment failures. Having STR Units that measure the actual lightning current, energy, and voltage data should improve the accuracy of these algorithms.
Figure 8.) to determine the probable number of transformer failures that might occur. This data along with equipment density data is used to predict the number and sizes of distribution transformers that need to be shipped from primary to secondary warehouses so an adequate quantity is available for line crews to replace failed units. This process has resulted in reducing the restoration time to restore service to outaged customers due to lightning equipment failures. Having STR Units that measure the actual lightning current, energy, and voltage data should improve the accuracy of these algorithms.


